The main screen
When you first open the web page, the screen, which will look something like this,
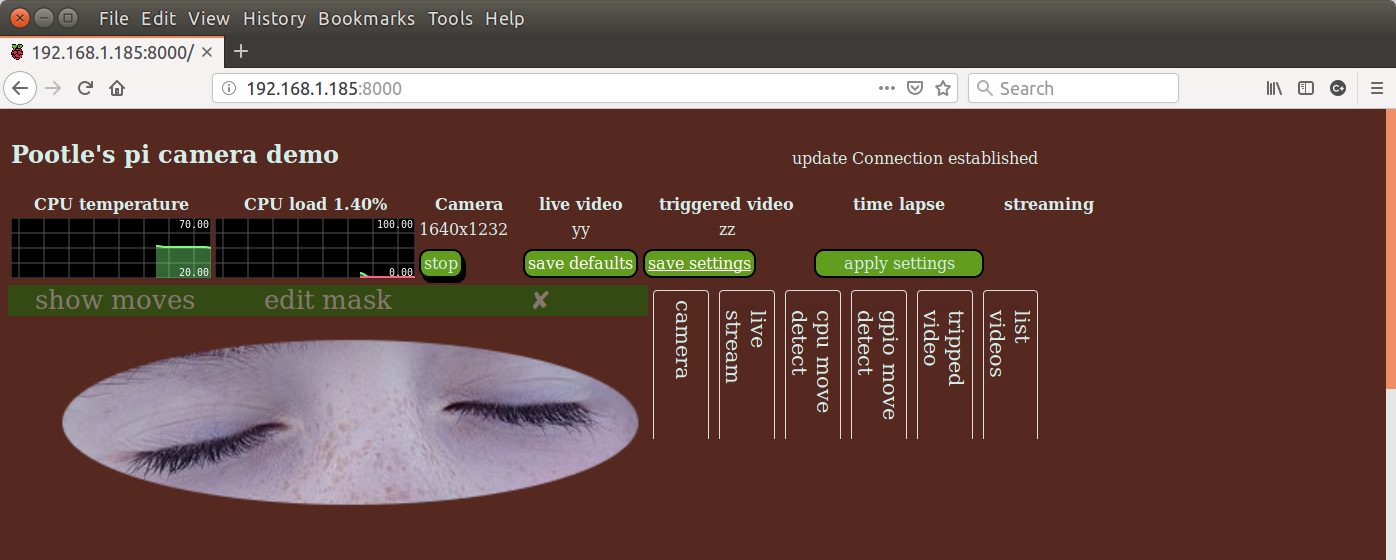
has 3 main areas:
- system summary and control - an overview of the overall system and some top level controls
- live view - when active - a default static image is shown initially
- tabbed panels with detailed controls for the various functions available
system summary and control
This area starts with two rolling graphs followed by top level controls:
- the current and recent CPU temperature - useful especially if your pi is in an enclosure
- the overall CPU utilisation - useful to make sure the Raspbery pi isn’t getting too busy
- some further controls like the camera control (the rest is still under construction)
The Camera Status
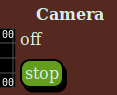
The camera control includes a simple status field and a button.
The status field typically shows:
- off - if the camera is not running
- the resolution the camera is using if it us running (e.g. 1296x972)
The camera is automatically turned off if nothing is using it after a timeout (the timeout can be set in the camera tab,
The button - “stop” - stops the camera, but only if nothing else is active. Changes to frame rate and overall resolution only take effect when the camera starts. If it is already running, it needs to be stopped and restarted if either of these fields is changed.
Several aspects of the camera’s operation can be controlled through the Camera tab see camera tab info here.
Live View
The live view area is initially inactive. clicking anywhere on the static image will start live view. The live view’s controls are in the live stream tab (see tabbed panels below or the detailed description of the live stream tab.
Note that on Raspberry pi Zero the live view uses significant resources - reducing the resolution will reduce this slightly. Also if other activities are running (like triggered video) a Raspberry pi zero does occasionally cause a kernel crash and stops the camera. This doesn’t seem to happen on Raspberry pi 2 or 3.
The live view can be stopped at any time by clicking on the ‘X’ by the top right of the live view area.
Immediately above the live view is the ‘edit mask’ button that overlays the live view with a mask used by the CPU movement detection activity. This is explained in mask editing.
Internally the live view stream is generated once and then replicated to all connected wenb browsers using a live view, this does put significant load on the network. Reducing the frame rate helps a lot.
Tabbed panels
There are more detailed control panels for the various functions in the tabbed panel area. Initially only the headings are shown, clicking on any heading will highlight the heading and display the relevant controls below the headings.
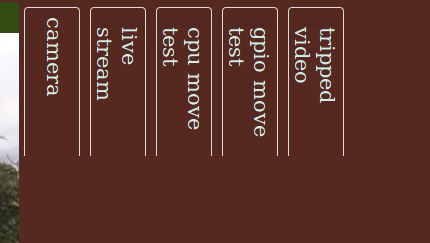
The following pages explain each of the tabs.